We recently launched a few features which make troubleshooting Serverless Framework services much easier. Before diving into the details, I’d like to share a personal story.
About three years ago I was vacationing with my family in Michigan. At the time I was acting as interim backend engineer for a startup. We were out on the lake with friends enjoying the afternoon sun when PagerDuty started going off. Each component started falling over one by one and the angry customer emails about the thousands of dollars they were losing each minute started piling up. After getting off the boat, getting online and pulling my hair out for three hours, we finally identified the root cause - Facebook’s APIs were responding about 40% slower than usual causing cascading slower response times in upstream dependencies and ultimately timeouts. This was an experience I would never wish upon anyone and I deeply sympathize with anyone who experiences such outages as a developer.
Such issues likely would have been avoided with a serverless architecture, but a few lessons are still applicable. Amongst them is the importance of monitoring the performance of each dependent service. And secondly, that it’s hard to do.
Given this experience, I am especially proud to show you how you can use the new invocation explorer and functions spans feature to troubleshoot issues similar to the one I experienced a few years ago.
To begin our troubleshooting journey, let’s assume we have a service with a few functions handling tens of thousands of invocations each hour. We are informed of degraded performance, but we have little to go on, other than knowing that there is a slow response time on a particular endpoint.
Invocation Explorer
First we need to identify the needle in the haystack. Luckily, we at least know what to look for. We know that the durations are probably taking longer than expected, we know the most likely functions causing the issue, and a time period during which the issue was reported.
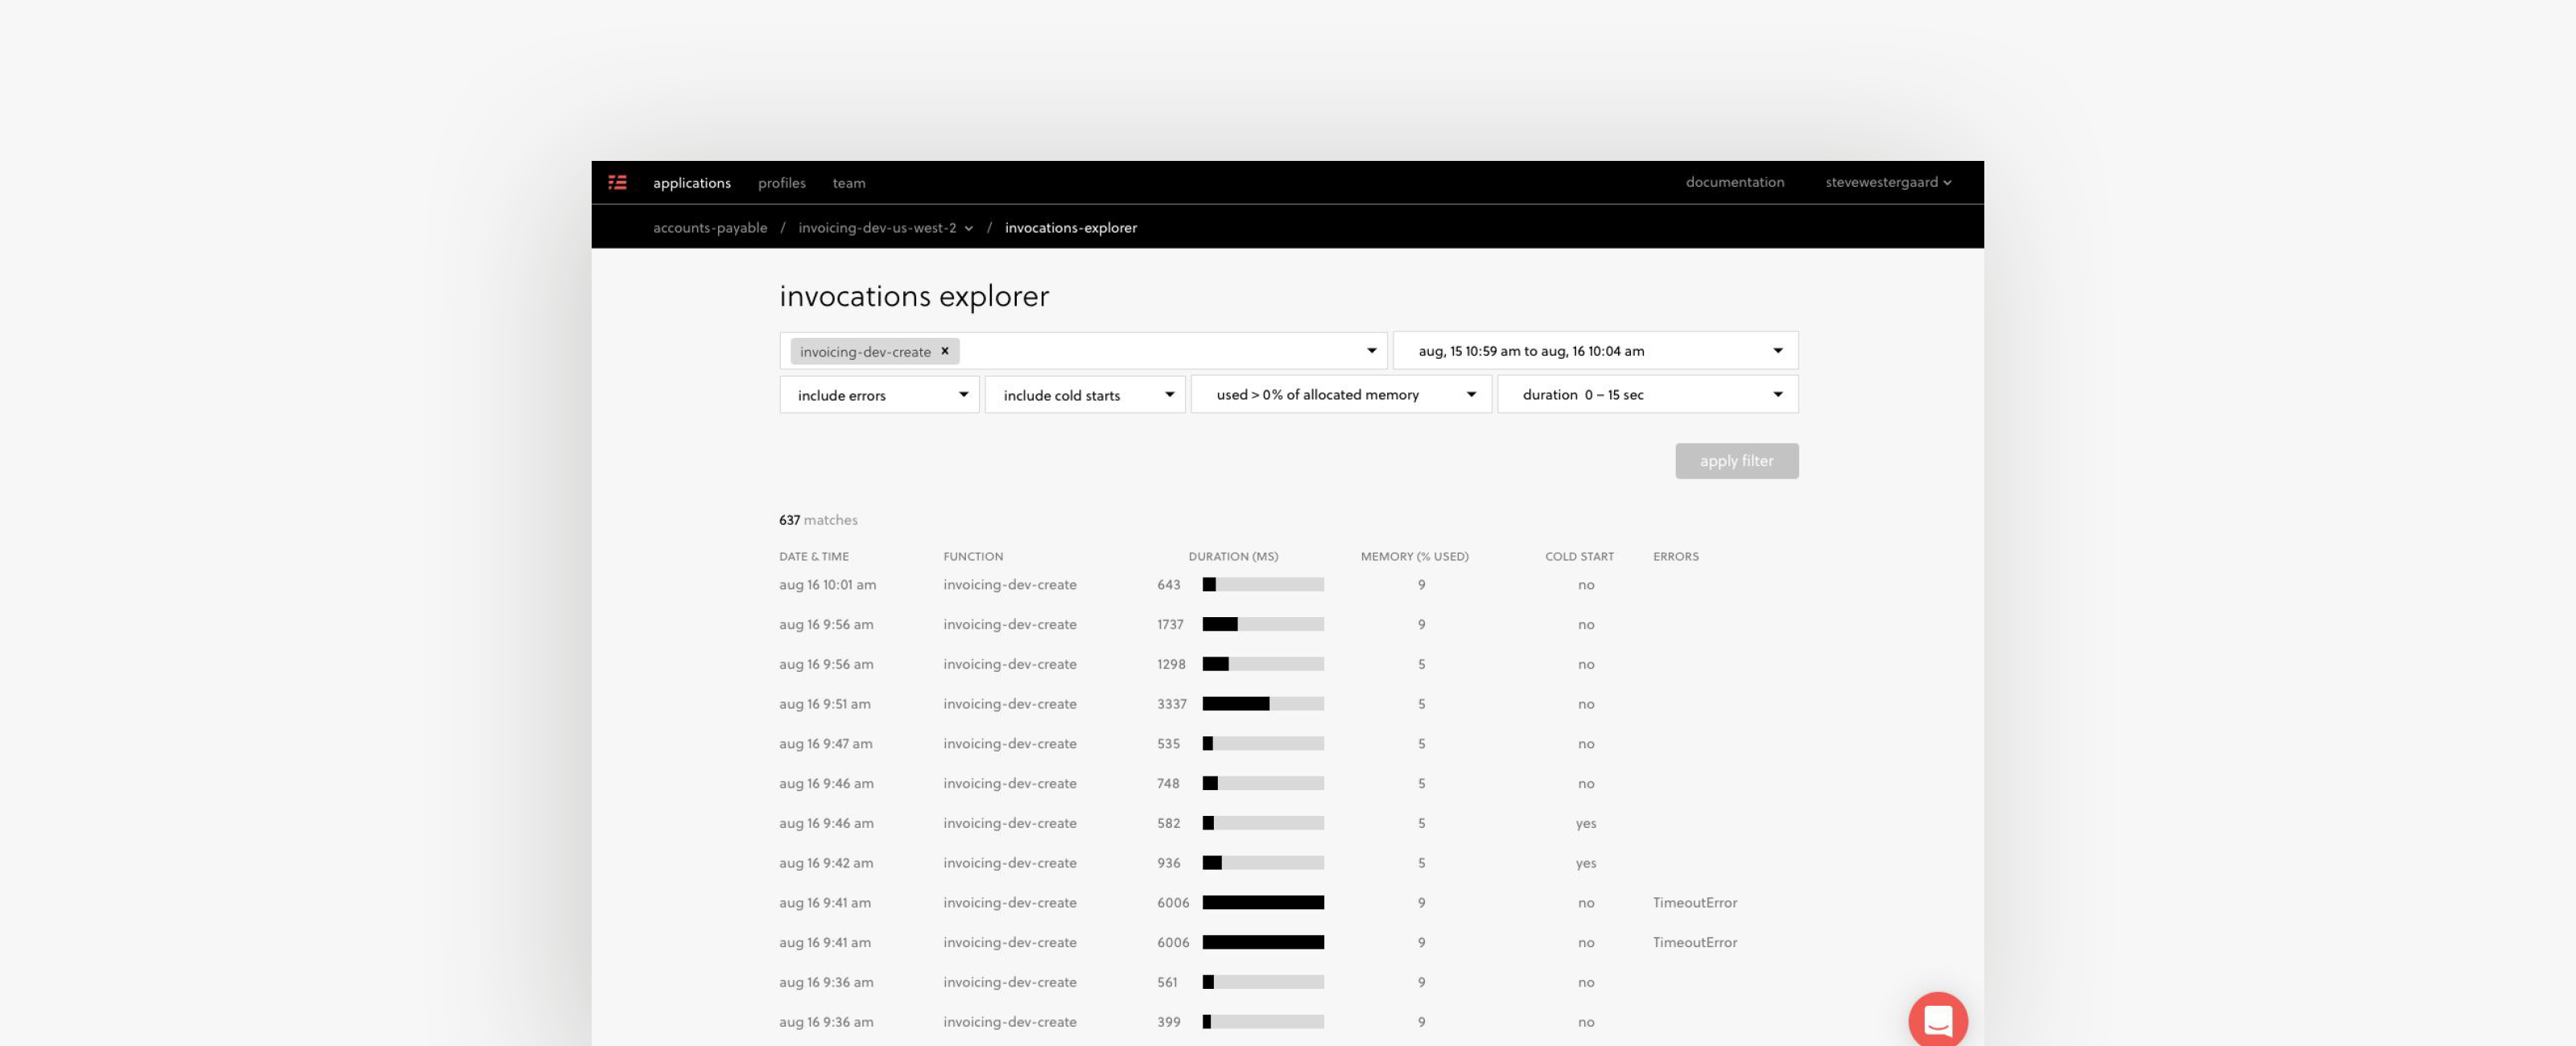
Using the invocation explorer we can quickly and easily identify the individual function invocations that match these characteristics by filtering on the function, time range, error state, cold start state, memory usage, and durations.
Once you apply the filter you’ll be able to see the timestamp, duration, memory utilization, cold start state, and the error if one occurred for every individual invocation which meets the filter criteria.

Invocation Details
While it is an improvement to be able to identify the invocations by a variety of filters and some basic stats about an invocation, we really need to dive into the details of each invocation to troubleshoot a problem.
When you click into an invocation using the invocation explorer you’ll see all of those details. The first section includes basic stats, including duration, memory usage, whether it had an error, or if it was a cold start.

The invocation details also include CloudWatch Logs, stack traces and functions spans, so let’s look at those in detail.
Logs
Long gone are the days of having to login to the AWS Console and sift through countless CloudWatch log streams to find the invocation logs you need. The “logs” section of the invocation details view loads the Cloud Watch logs for that particular invocation so any debugging logs your function generated are now available at your fingertips.

Stack trace
The invocation details view also includes the stack trace for your selected invocation. Perhaps the most popular and valuable tool for debugging your code, the stack trace will show you the exact line of code which caused the error and you’ll be able to navigate through the stack as well. Even if your code is obfuscated by typescript or minification you’ll be able to get this nice view with support for Source Maps.

Function spans
With function spans you can quickly pinpoint the cause of a slow response time. Every call to AWS services like S3, DynamoDB, SES, and more is automatically instrumented and visualized so you can see when the call was made and how much time your function spent waiting for a response. Soon we’ll also be adding support for HTTP(S) calls too.
This would have been the killer feature for debugging the issue I described earlier. Without adding any manual instrumentation, I would have been able to see exactly how much time my function spent on dependent service calls and notice the performance degradation.

Alerts & Charts
While the troubleshooting journey may begin with a user reported issue; it may also begin with a notification from Serverless Framework. Serverless Framework provides notifications for a variety of alerts like approaching out of memory, new error type identified, or numerous others. Each of these alerts is now instrumented with a link to “View Invocations”.

When you follow this link, you will jump right into the invocation explorer with the filter pre-set to view the invocations which contributed to the particular alert. For example, if you get a New Error Type identified alert, you’ll be able to navigate to the invocation explorer to see the exact invocations which had that error and see the stack trace.
Similarly, you can view the function invocations & errors for a service instance, or the invocation, errors, cold starts or timeouts per function. When you click on any one of the data points in these charts you will land on the invocation explorer with the list filtered for those particular invocations.

Automatic instrumentation
As I mentioned in my own troubleshooting journey a few years ago, we hadn’t instrumented all of our code to track the performance of all the countless dependent services. With Serverless Framework you DO NOT need to instrument your code to get the invocation explorer or function spans. Upon deployment, the Serverless Framework will automatically instrument all calls to AWS services and (coming soon) HTTP services.
Try it out for yourself
If you have an existing service, first make sure you are using the latest release of the Serverless Frameworking by running npm i serverless -g. Then run serverless in your working directory. If you have an existing Serverless account, it’ll walk you through updating your serverless.yml to work with the dashboard features. If you don’t have an existing account you’ll be prompted to create one. It’s that easy.


